Key Indicators
COVID-19 Wastewater Surveillance
Marin County Public Health uses wastewater (sewage) to monitor levels of community virus transmission. This dashboard shows the amount of virus detected in six wastewater collection sites, which cover about 85% of the Marin population, and a composite measure of all sites combined.
The Marin COVID Level is displayed as “High”, “Medium”, or “Low”, based on levels of virus in all 6 sites combined and the number of people currently in Marin County hospitals who have tested positive for COVID-19. In addition to the County-wide COVID level, we provide an indicator of the trend in wastewater virus levels in each area to indicate if levels are increasing, decreasing, or staying stable.
Samples are collected 1-3 times per week and the chart is updated weekly. More information about wastewater surveillance can be found here. Wastewater levels for Respiratory Syncytial Virus (RSV) and influenza are available on the Marin County flu surveillance data page.
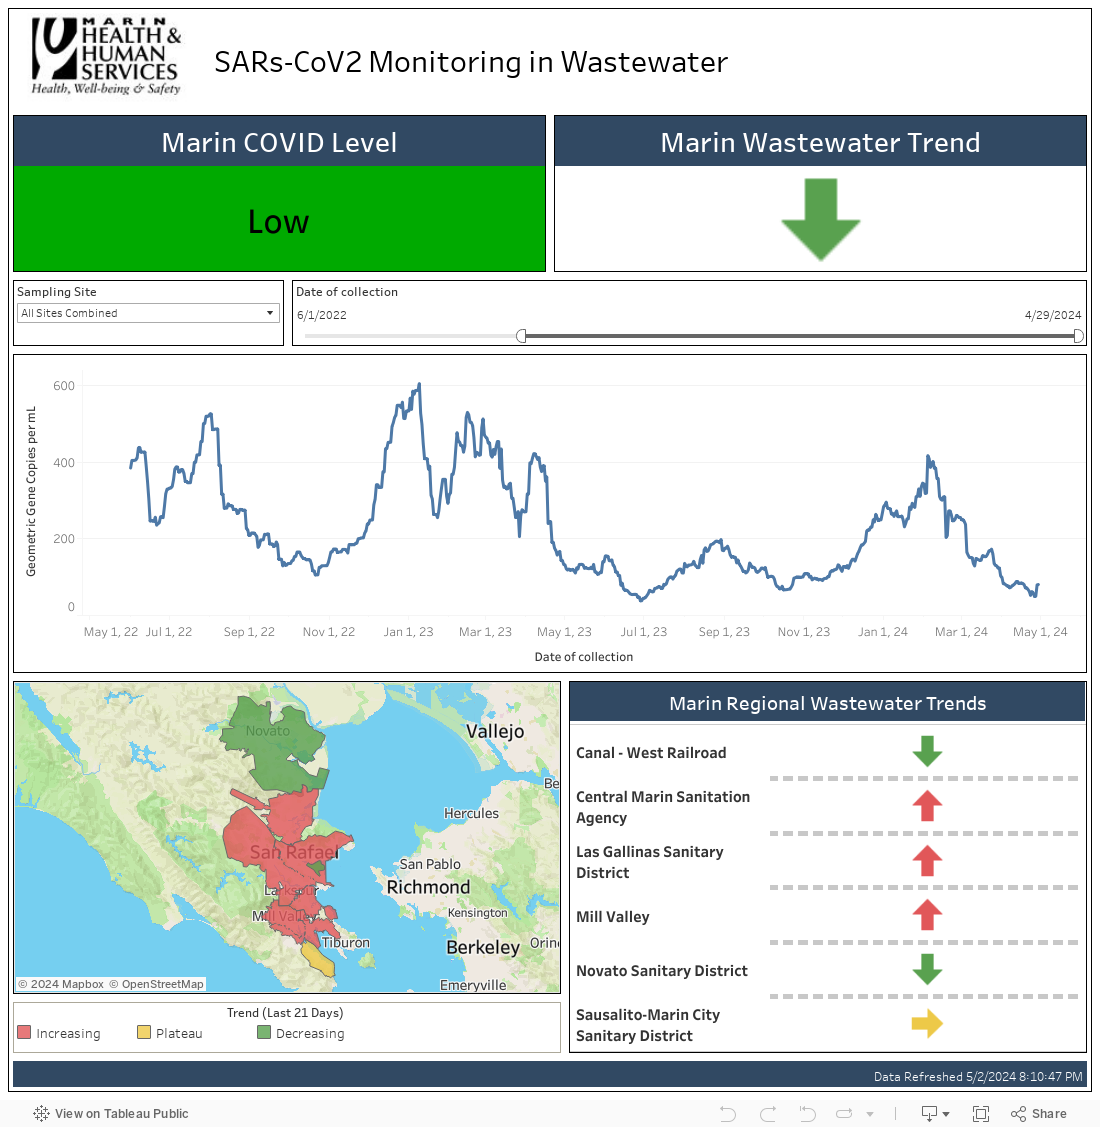
Data Source: Marin H&HS, UC Berkeley Covid-WEB, Verily, and BioBot.
COVID-19 Hospitalizations
This chart displays two indicators related to COVID-19 hospitalizations in Marin County’s three acute care hospitals– MarinHealth Medical Center, Kaiser San Rafael, and Novato Community Hospital. Hospitalized Patients is the total number of patients with COVID-19 staying in the hospital each day. Most patients who are admitted stay several days. ICU Patients shows the number of patients with COVID-19 occupying ICU beds. The data are lagged by 6-7 days and are updated weekly.
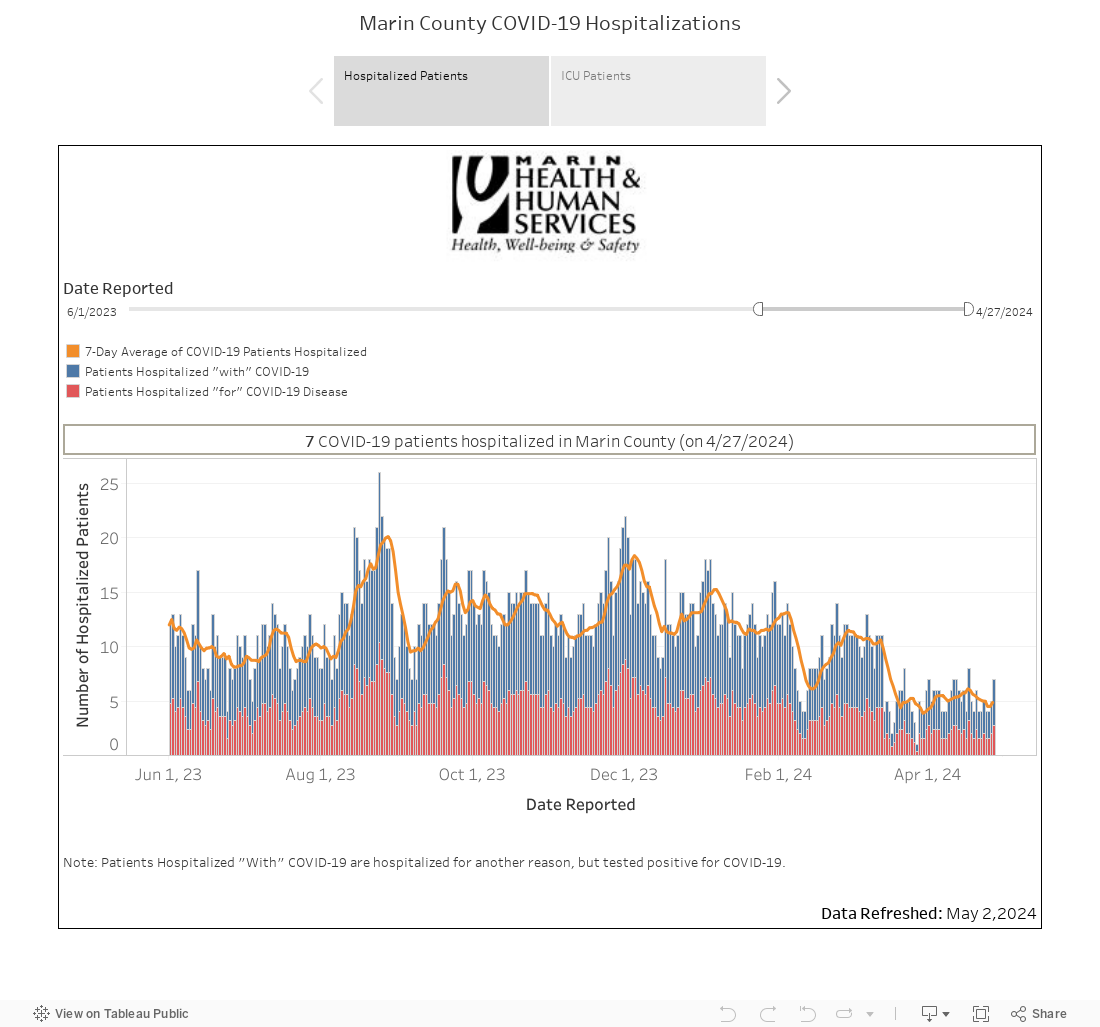
Data Source: CDPH Hospitalization Data
Prevalence of Variants of SARS-CoV-2 in Marin County
This chart displays the weekly proportion of COVID-19 variants of concern (VOC) identified through whole genome sequencing (WGS) in Marin County. These data are updated on Fridays by Marin County Public Health. Not all positive samples are sequenced, and it can take up to 21 days to receive results, so this may not represent all of the circulating variants in the community. Variants not classified as VOC (defined here) by the CDC are grouped in the "other" category.
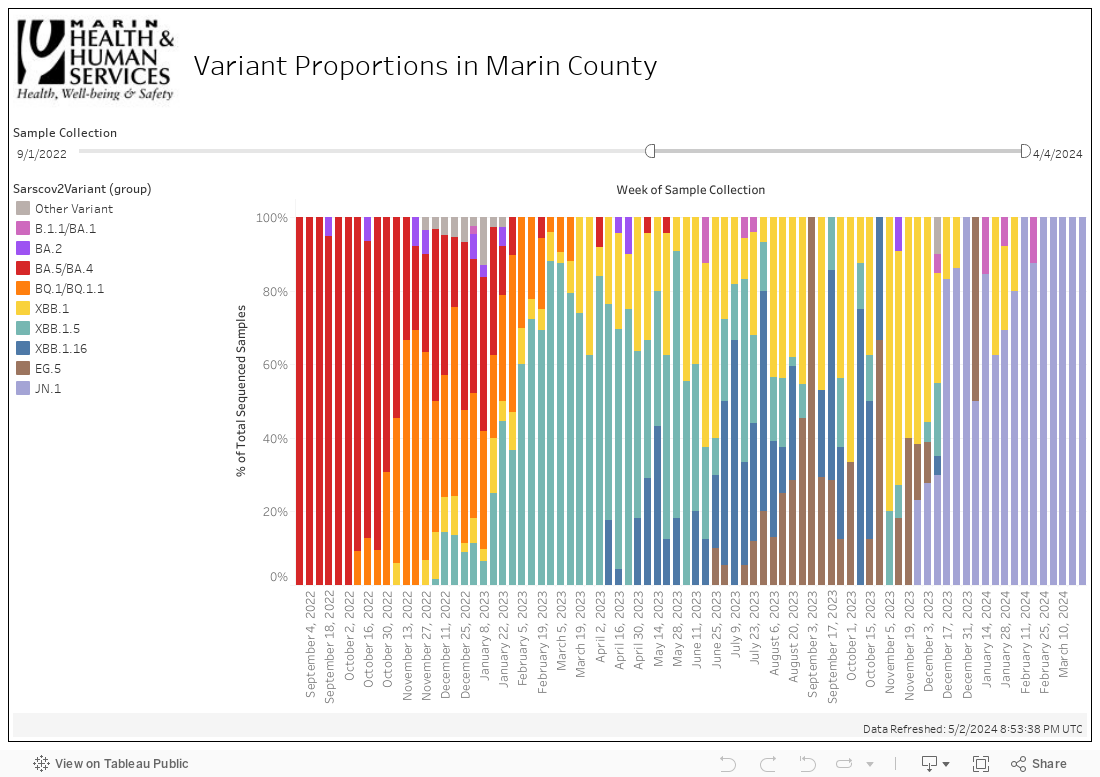
Data Source: Source: COVID-19 SARS-CoV-2 Whole Genome Sequencing, California Department of Public Health, Napa-Solano-Yolo-Marin-Mendocino Regional Public Health Laboratory, academic partners, and commercial laboratories.
School/Childcare and Long-Term Care Facility Outbreaks
In long-term care and congregate living facilities, an outbreak is defined as one or more facility-acquired confirmed case; or, three or more suspect or confirmed cases that are linked (CDPH). In TK-12 schools, an outbreak is reported when cases reach 5% of the school student population within 14 days (CDPH). In childcare facilities, an outbreak is generally three or more cases that are linked, within 14-day period (CDSS).
COVID-19 Vaccinations
COVID-19 Vaccinations
This dashboard shows COVID-19 vaccine doses administered to Marin County residents. State and National data that show comparisons of COVID-19 outcomes for vaccinated and unvaccinated people are a useful tool to evaluate risk. To view these resources, visit the CDPH COVID Data Tracker webpage and the CDC COVID Data Tracker webpage. The dashboard below is updated weekly by CDPH.
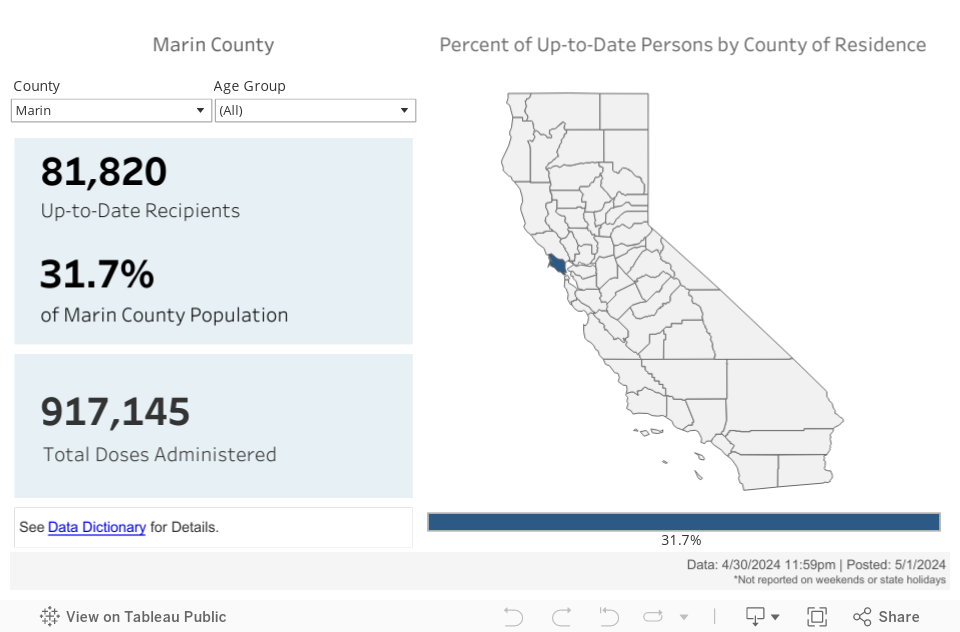
Data Source: CDPH Vaccine Progress Dashboard Data
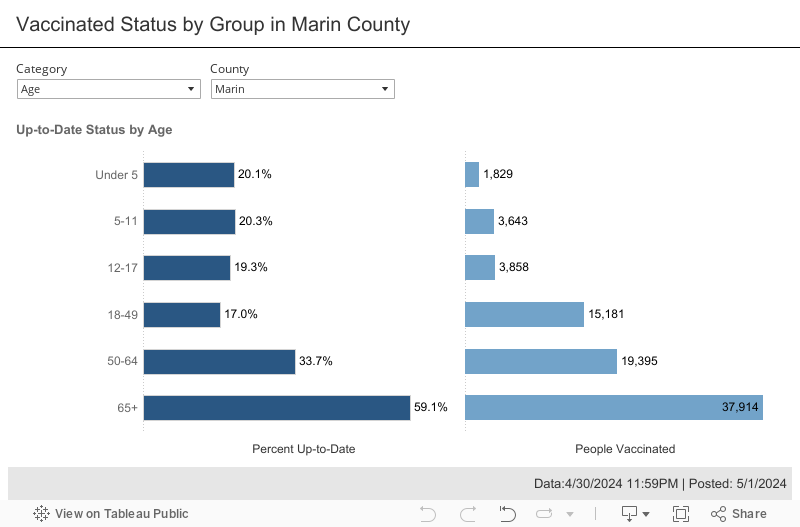
COVID-19 Vaccination Demographics
This dashboard shows the percent of Marin County residents by age group and race/ethnicity that have received the primary series and booster doses. This dashboard also includes a Vaccine Equity Metric, using the Healthy Places Index (HPI) to describe inequities between communities within Marin County. These data are updated weekly by CDPH.
Data Source: CDPH Vaccine Progress Dashboard Data
Other Indicators
All-Cause Deaths
Looking at total deaths from all causes tells us if we are seeing fewer or more deaths than usual in Marin County. The chart below shows the two-week rolling average of all-cause deaths among Marin County residents in the pandemic years 2020, 2021, 2022, and 2023 compared to 2018 and 2019 combined.
How to Use this Dashboard
Tips:
- For best viewing options across most devices select the "Full Screen" icon in the very bottom right hand corner of each dashboard.
- Adjusting the Date slider above charts will modify the date range in the view; move the date sliders to the right or left with a mouse. This allows users to zoom into smaller periods of time.
- To highlight particular features (lines/bars) in the charts, select an item in the legend either by clicking it with a mouse or tabbing to it and pressing the Spacebar.
- To see the data behind each chart select the "Download" icon in the bottom right of the dashboard and select "Crosstab", then select the specific chart of interest. Full datasets are linked below each dashboard, directing the user to Marin County's Open Data Portal. Another way to see a data table is to tab to put focus on a chart and then press Enter.
Accessibility:
Every attempt has been made to enable the data visualizations accessible for keyboard navigation and screen readers. Tableau provides specific keyboard navigation instructions on their website. If you have a disability and need assistance with the information on this page, use the COVID-19 contact form to submit your access questions or call the state COVID-19 CA Hotline (833)422-4255.
Other Marin County Public Health Data Dashboards
Click here to explore Marin County Public Health dashboards that provide data on the health of Marin residents.